Platform data upload
Recording
Here we show a simple example where we merge and analyze data from 2 pharmaceutical companies, uploaded via a data upload.
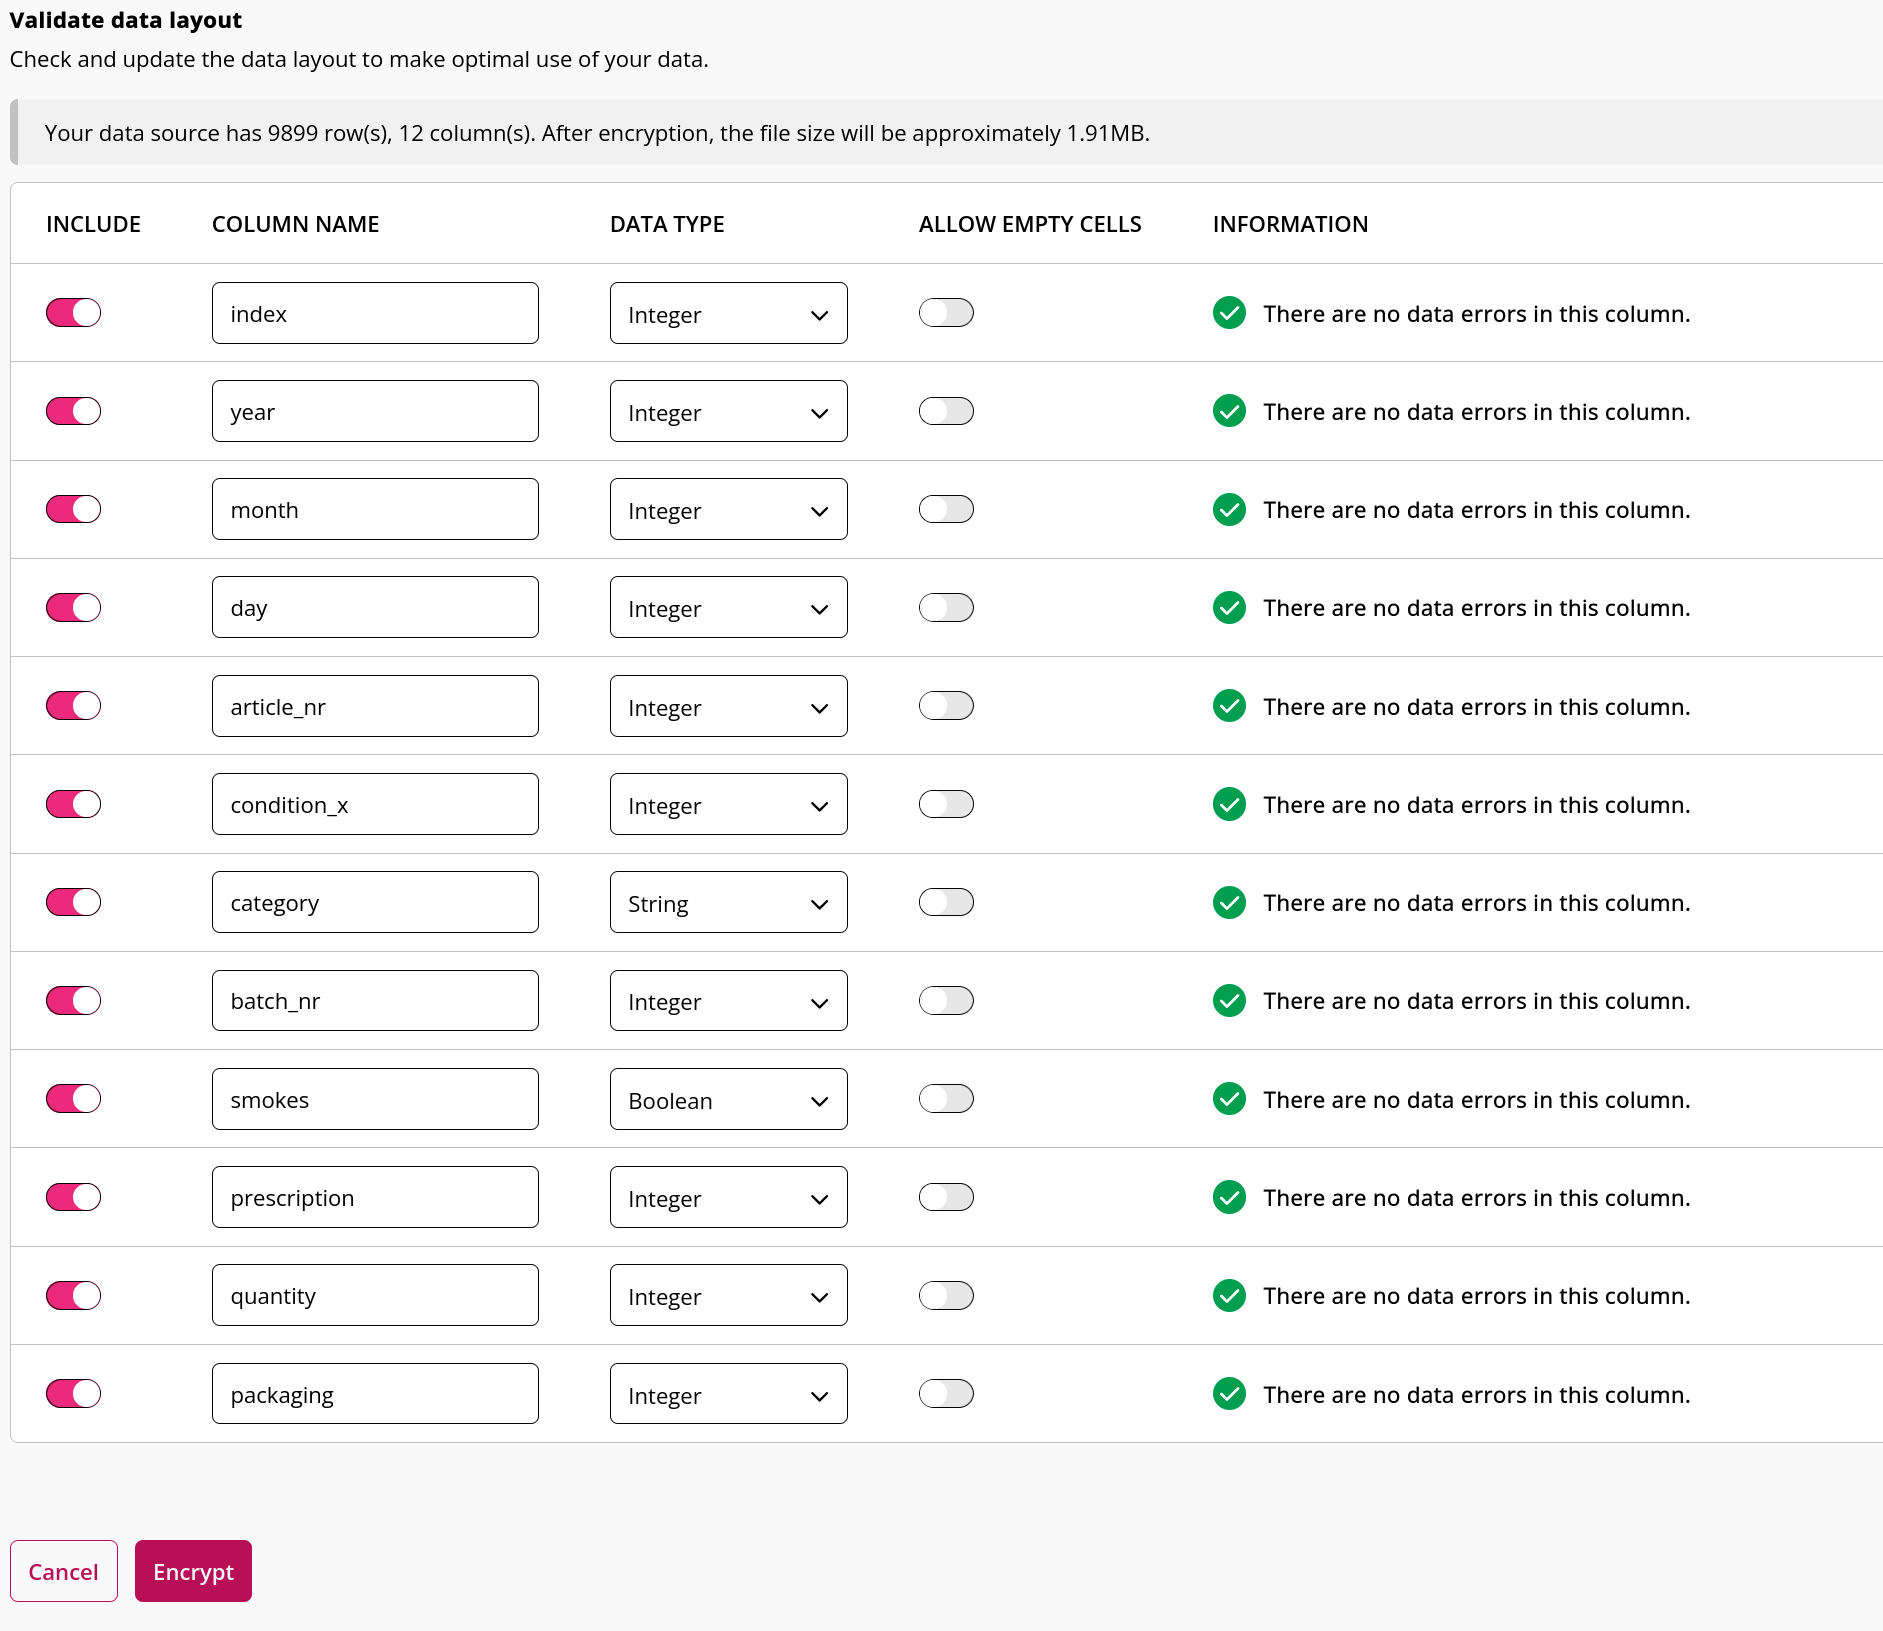
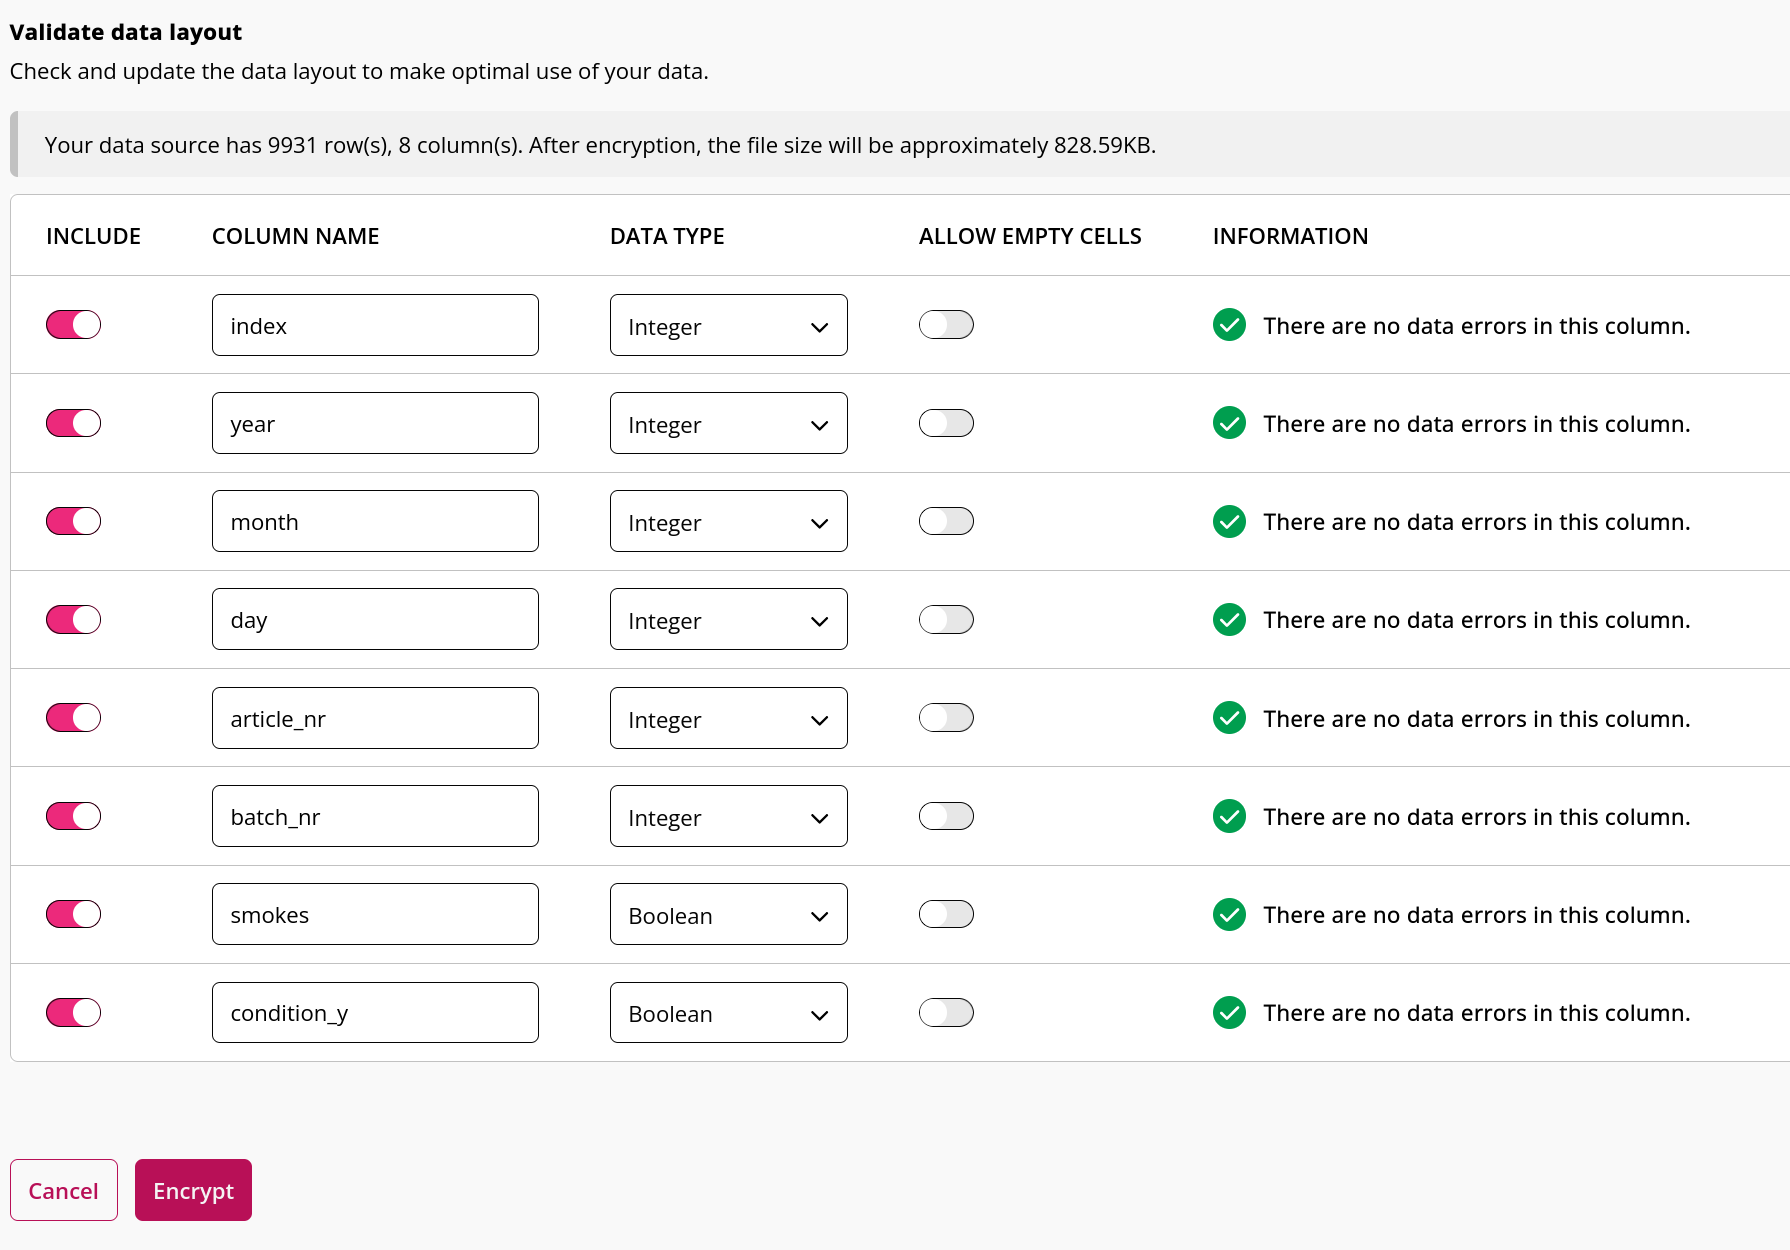
We start by uploading the production datasets to the authorized platform (in practice, this would be done by the actual data providers).
Dataset 1

Dataset 2

In order to record a script, we need to create a table with the same structure as the real data (i.e. the data that will be used in production). This dummy data will be used in the script recording as a stand-in for the actual data that is uploaded to the platform. The structure of both production datasets can be accessed there. We now log-in to the design platform and upload our dummy data there (verify that the data layout is identical to the layout of the layout of the production data).
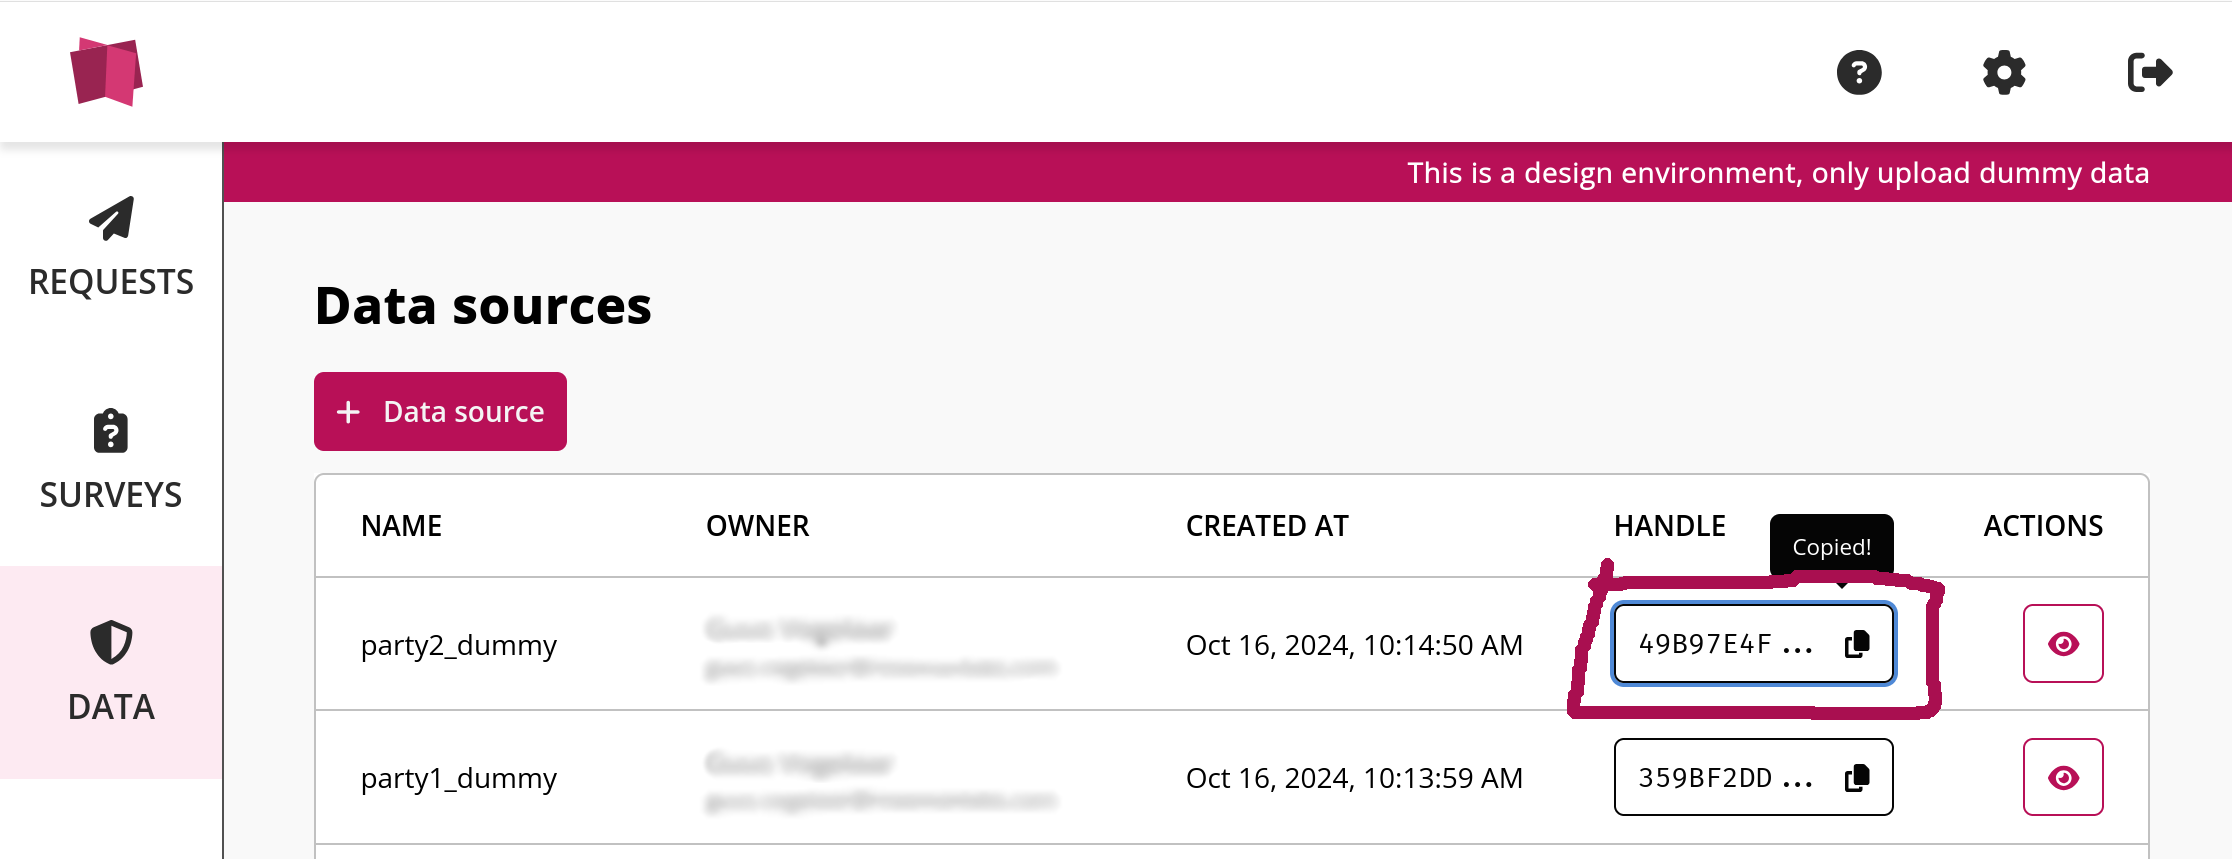
Now that we have uploaded the datasets, we can navigate to the data source view for one of our dummy datasets in the design platform and copy the following code snippet (the values for DESIGN_ENV and DUMMY_HANDLE should have been filled in):
import crandas as cd

# copy from design platform:
DESIGN_ENV = "vdl-design-demo"
DUMMY_HANDLE = "359BF2DD26A4EE2144B1C4D92223AA9D3A57280B4DE29149FAC2B5430EDFE5ED"

# copy from authorized platform:
AUTH_ENV = ""
ANALYST_KEY = ""
PROD_HANDLE = ""
SCHEMA = {''}

# fill this in yourself (no spaces):
ANALYSIS_NAME = ""

cd.script.reset()
cd.connect(DESIGN_ENV, analyst_key=ANALYST_KEY)
cd.get_table(DUMMY_HANDLE).save(dummy_for=PROD_HANDLE)
script = cd.script.record(name=ANALYSIS_NAME, path=ANALYSIS_NAME + '.recording')
table = cd.get_table(PROD_HANDLE, schema=SCHEMA)

## add any analysis on `table`

script.end()
Since we want to perform an analysis on two datasets, we also add the handle of the other dummy dataset here (which we can copy from the platform):

# copy from design platform:
DESIGN_ENV = "vdl-design-demo"
DUMMY_HANDLE = "359BF2DD26A4EE2144B1C4D92223AA9D3A57280B4DE29149FAC2B5430EDFE5ED"
DUMMY_HANDLE_2 = "49B97E4FEFA4E700D781DAACC678719245D3C60FD355F67121B1E3C9A12185CD"
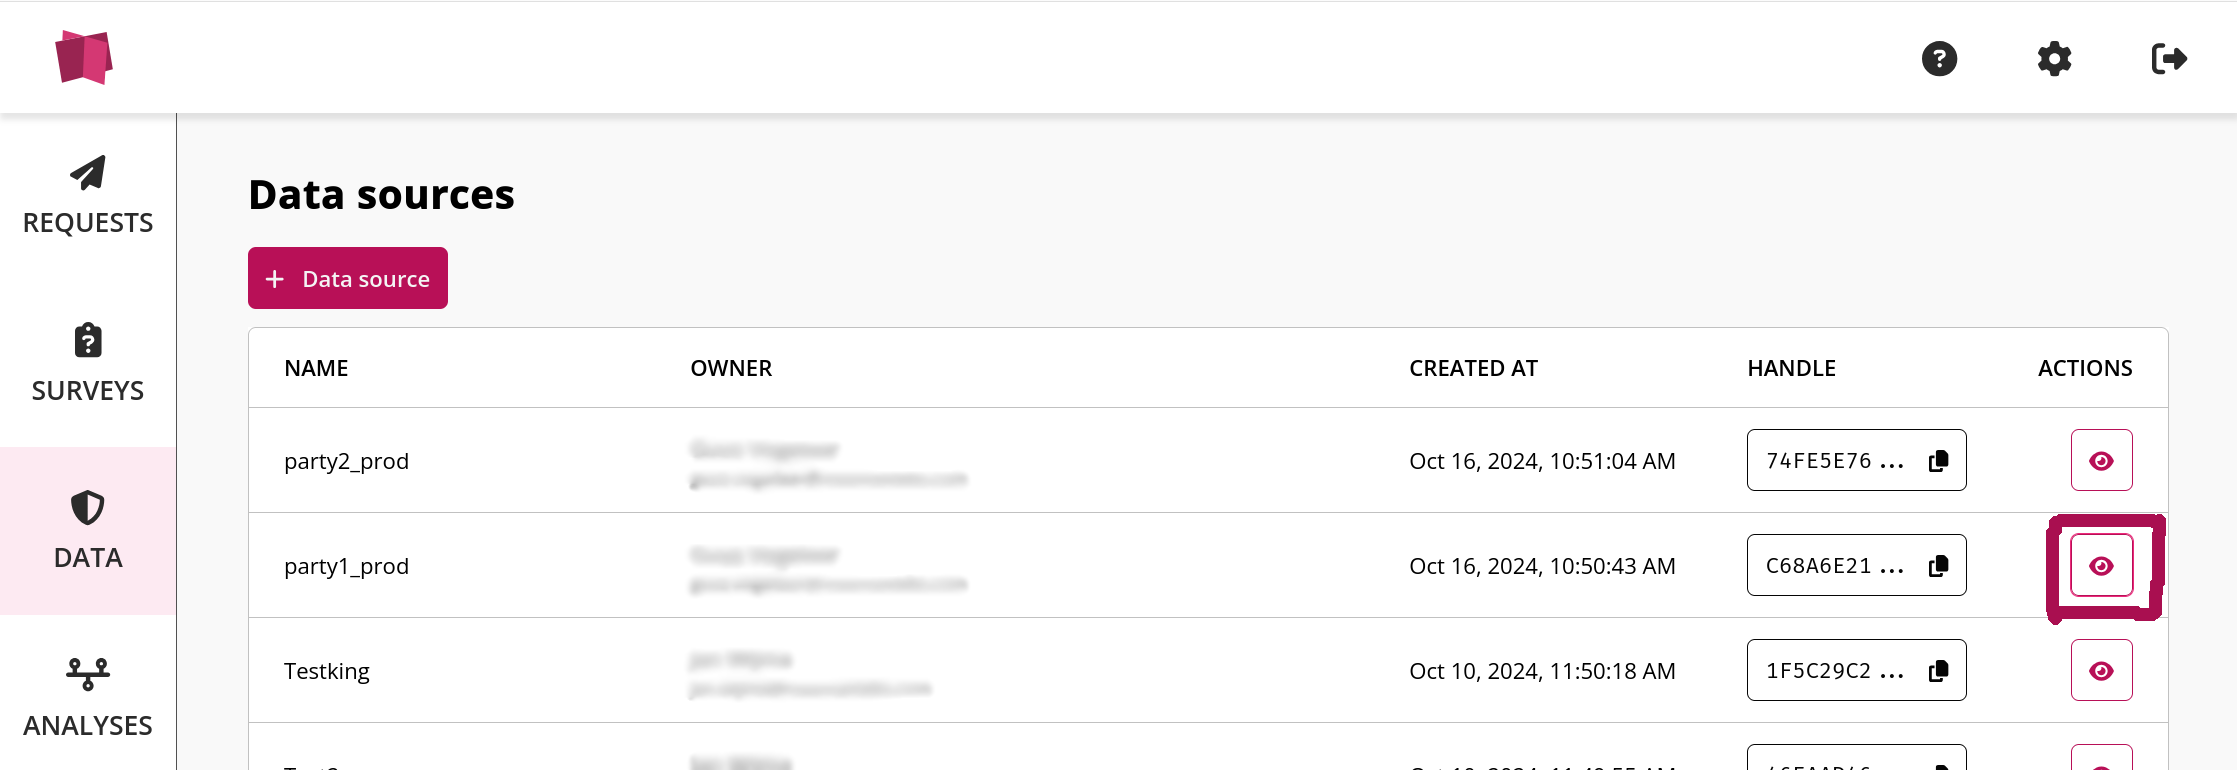
Now we navigate to the authorized platform, and select the data source view of the dummy dataset corresponding to dummy table 1.

Here we can find the values for the capitalized environment variables of the authorized platform, which we can copy into the script:
# copy from design platform:
DESIGN_ENV = "vdl-design-demo"
DUMMY_HANDLE = "359BF2DD26A4EE2144B1C4D92223AA9D3A57280B4DE29149FAC2B5430EDFE5ED"
DUMMY_HANDLE_2 = "49B97E4FEFA4E700D781DAACC678719245D3C60FD355F67121B1E3C9A12185CD"

# copy from authorized platform:
AUTH_ENV = "vdl-demo"
ANALYST_KEY = "vdl-demo-private-key.sk"
PROD_HANDLE = "C68A6E217650F072E8BA585C6E3446CFFE38CE9E44E6C9AEDBADBA47CAE1E218"
SCHEMA = {
    'index':'int',
    'year':'int',
    'month':'int',
    'day':'int',
    'article_nr':'int',
    'condition_x':'int',
    'category':'varchar',
    'batch_nr':'int',
    'smokes':'bool',
    'prescription':'int',
    'quantity':'int',
    'packaging':'int'
}
Afterwards, add the handle and schema of the second production dataset. Also, fill in the analysis name.
# copy from design platform:
DESIGN_ENV = "vdl-design-demo"
DUMMY_HANDLE = "359BF2DD26A4EE2144B1C4D92223AA9D3A57280B4DE29149FAC2B5430EDFE5ED"
DUMMY_HANDLE_2 = "49B97E4FEFA4E700D781DAACC678719245D3C60FD355F67121B1E3C9A12185CD"

# copy from authorized platform:
AUTH_ENV = "vdl-demo"
ANALYST_KEY = "vdl-demo-private-key.sk"
PROD_HANDLE = "C68A6E217650F072E8BA585C6E3446CFFE38CE9E44E6C9AEDBADBA47CAE1E218"
SCHEMA = {
    'index':'int',
    'year':'int',
    'month':'int',
    'day':'int',
    'article_nr':'int',
    'condition_x':'int',
    'category':'varchar',
    'batch_nr':'int',
    'smokes':'bool',
    'prescription':'int',
    'quantity':'int',
    'packaging':'int'
}
PROD_HANDLE_2 = "74FE5E767FB36E084BE5B7EFD692C880DF99953CD4BE834C4193713A48A8CD17"
SCHEMA_2 = {
    'index':'int',
    'year':'int',
    'month':'int',
    'day':'int',
    'article_nr':'int',
    'batch_nr':'int',
    'smokes':'bool',
    'condition_y':'bool'
}

# fill this in yourself (no spaces):
ANALYSIS_NAME = "analysis"
Now that we have defined all environment variables and referenced the dummy and production datasets, we can add our actual analysis code to the script. Here, we join the two tables and retrieve some simple statistics:
import crandas as cd

# copy from design platform:
DESIGN_ENV = "vdl-design-demo"
DUMMY_HANDLE = "359BF2DD26A4EE2144B1C4D92223AA9D3A57280B4DE29149FAC2B5430EDFE5ED"
DUMMY_HANDLE_2 = "49B97E4FEFA4E700D781DAACC678719245D3C60FD355F67121B1E3C9A12185CD"

# copy from authorized platform:
AUTH_ENV = "vdl-demo"
ANALYST_KEY = "vdl-demo-private-key.sk"
PROD_HANDLE = "C68A6E217650F072E8BA585C6E3446CFFE38CE9E44E6C9AEDBADBA47CAE1E218"
SCHEMA = {
    'index':'int',
    'year':'int',
    'month':'int',
    'day':'int',
    'article_nr':'int',
    'condition_x':'int',
    'category':'varchar',
    'batch_nr':'int',
    'smokes':'bool',
    'prescription':'int',
    'quantity':'int',
    'packaging':'int'
}
PROD_HANDLE_2 = "74FE5E767FB36E084BE5B7EFD692C880DF99953CD4BE834C4193713A48A8CD17"
SCHEMA_2 = {
    'index':'int',
    'year':'int',
    'month':'int',
    'day':'int',
    'article_nr':'int',
    'batch_nr':'int',
    'smokes':'bool',
    'condition_y':'bool'
}

# fill this in yourself (no spaces):
ANALYSIS_NAME = "analysis"

cd.script.reset()
cd.connect(DESIGN_ENV, analyst_key=ANALYST_KEY)

cd.get_table(DUMMY_HANDLE).save(dummy_for=PROD_HANDLE) # link dummy table to production handle
cd.get_table(DUMMY_HANDLE_2).save(dummy_for=PROD_HANDLE_2) # link dummy table to production handle

script = cd.script.record(name=ANALYSIS_NAME, path=ANALYSIS_NAME + '.recording')

###### BEGIN: COPY TO AUTHORIZED SCRIPT ################

table = cd.get_table(PROD_HANDLE, schema=SCHEMA)
table2 = cd.get_table(PROD_HANDLE_2, schema=SCHEMA_2)

# inner join table and table2 on identical keys
merged = cd.merge(table, table2, how="inner", on=['year', 'month', 'day', 'article_nr', 'batch_nr', 'smokes'], validate="1:1")
repr(merged)

# retrieve statistics
print('Average occurance of condition_y: ' + str(merged['condition_y'].mean()))

smokers = merged.filter(merged['smokes'] == True)
print('Average occurance of condition_y for smokers: ' + str(smokers['condition_y'].mean()))

def compute_sum(month):
    try:
        result = merged[((merged["condition_y"]==1) & (merged['month']==month)).with_threshold(3)]["condition_y"].sum()
        return result             # computes means only if there are 3 cases for the month
    except:
        return None                # if not, no output is given

dic={"Month": ['Jan', 'May', 'September'], "Sum of Asthma": [
    compute_sum(1),compute_sum(5),compute_sum(9)]}

# Data visualization is done with data that is already in the clear, so it does not need to be within the script recording.
# But it can
import plotly.express as px

plot=px.bar(dic, x="Month", y="Sum of Asthma")
plot.show()

script.end()

###### END: COPY TO AUTHORIZED SCRIPT ################
This will produce a .recording file, which we can get approved and run on sensitive production data (see also step 8 in
this) article.