Survey
Recording
Here we show a simple example where we merge and analyze data from survey responses.
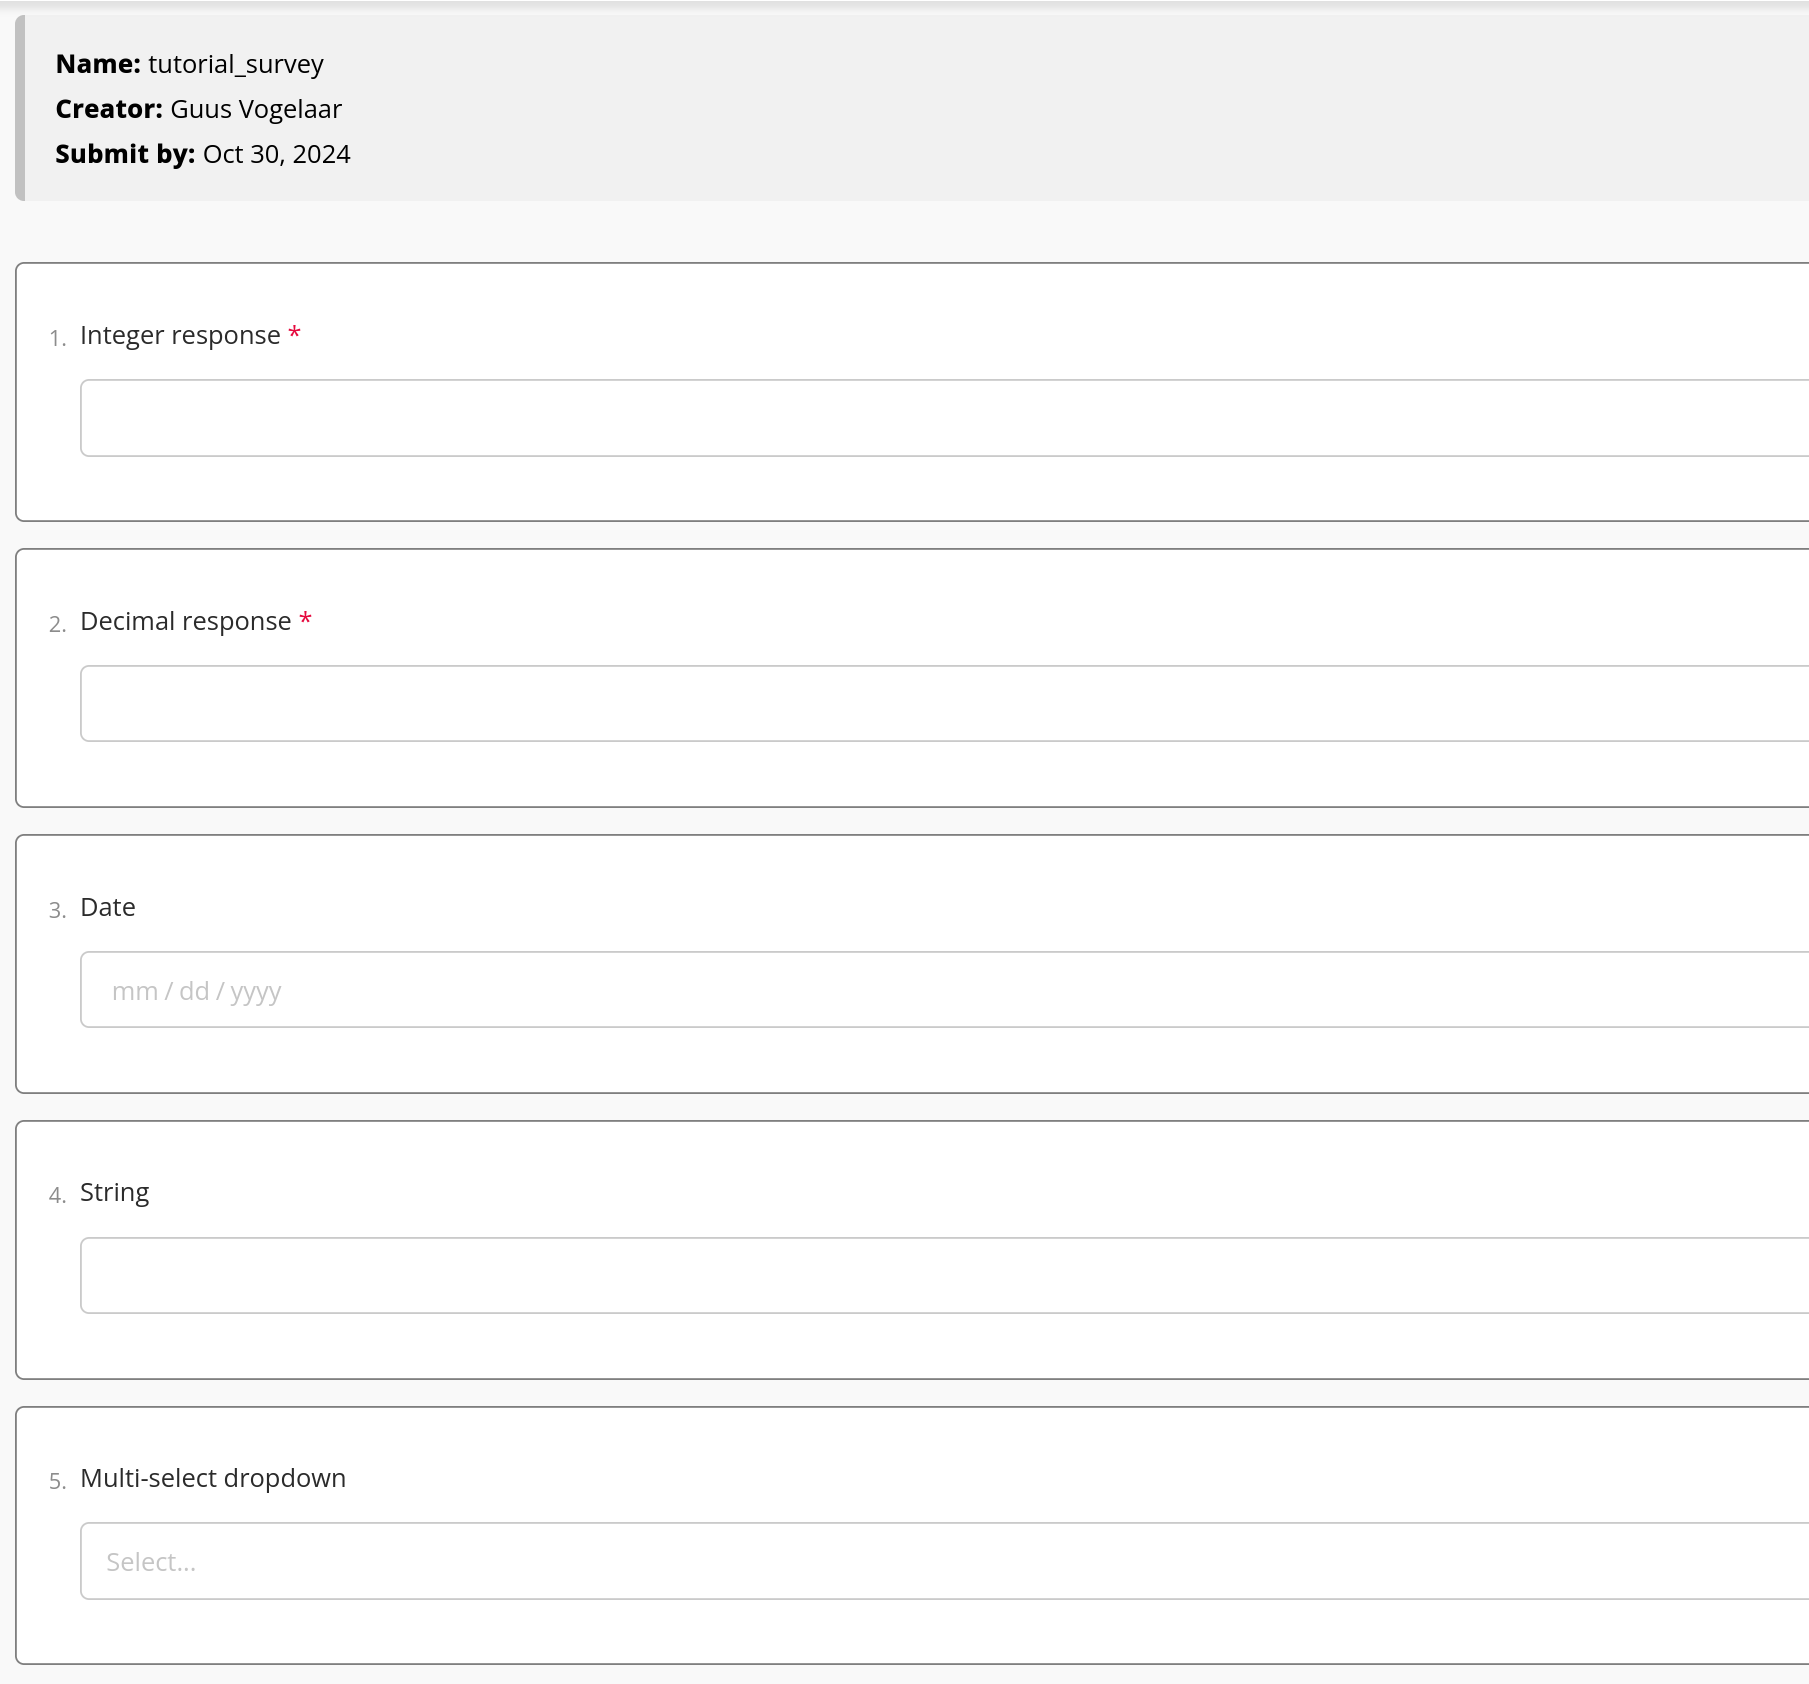
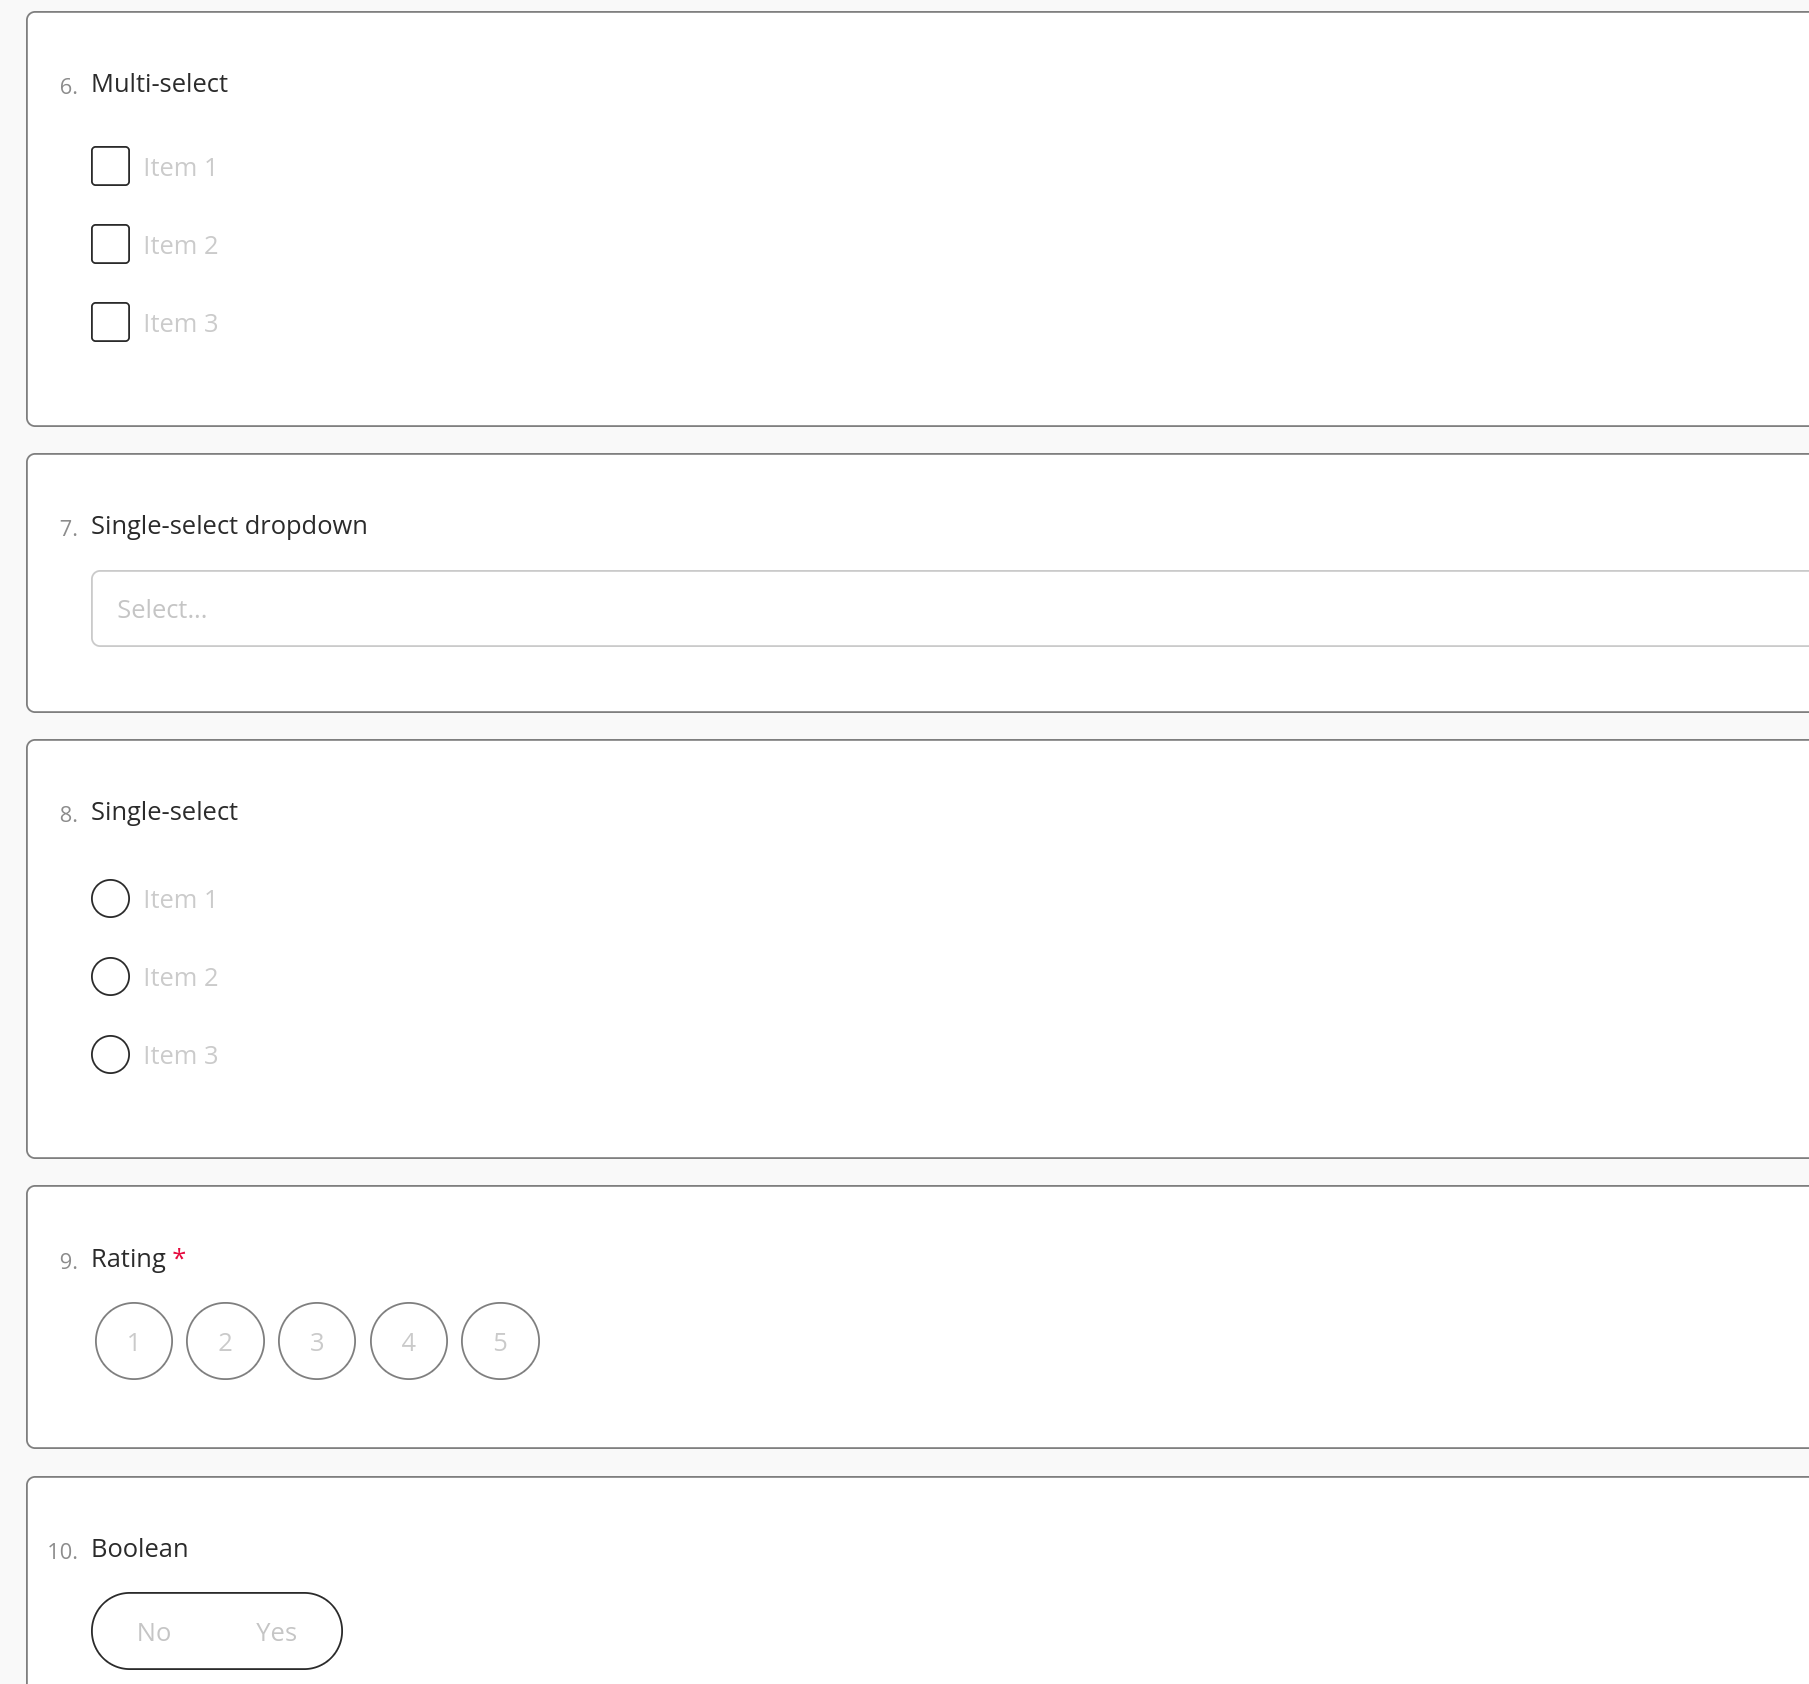
We start by creating a simple survey in the authorized environment, containing different question types.
Survey


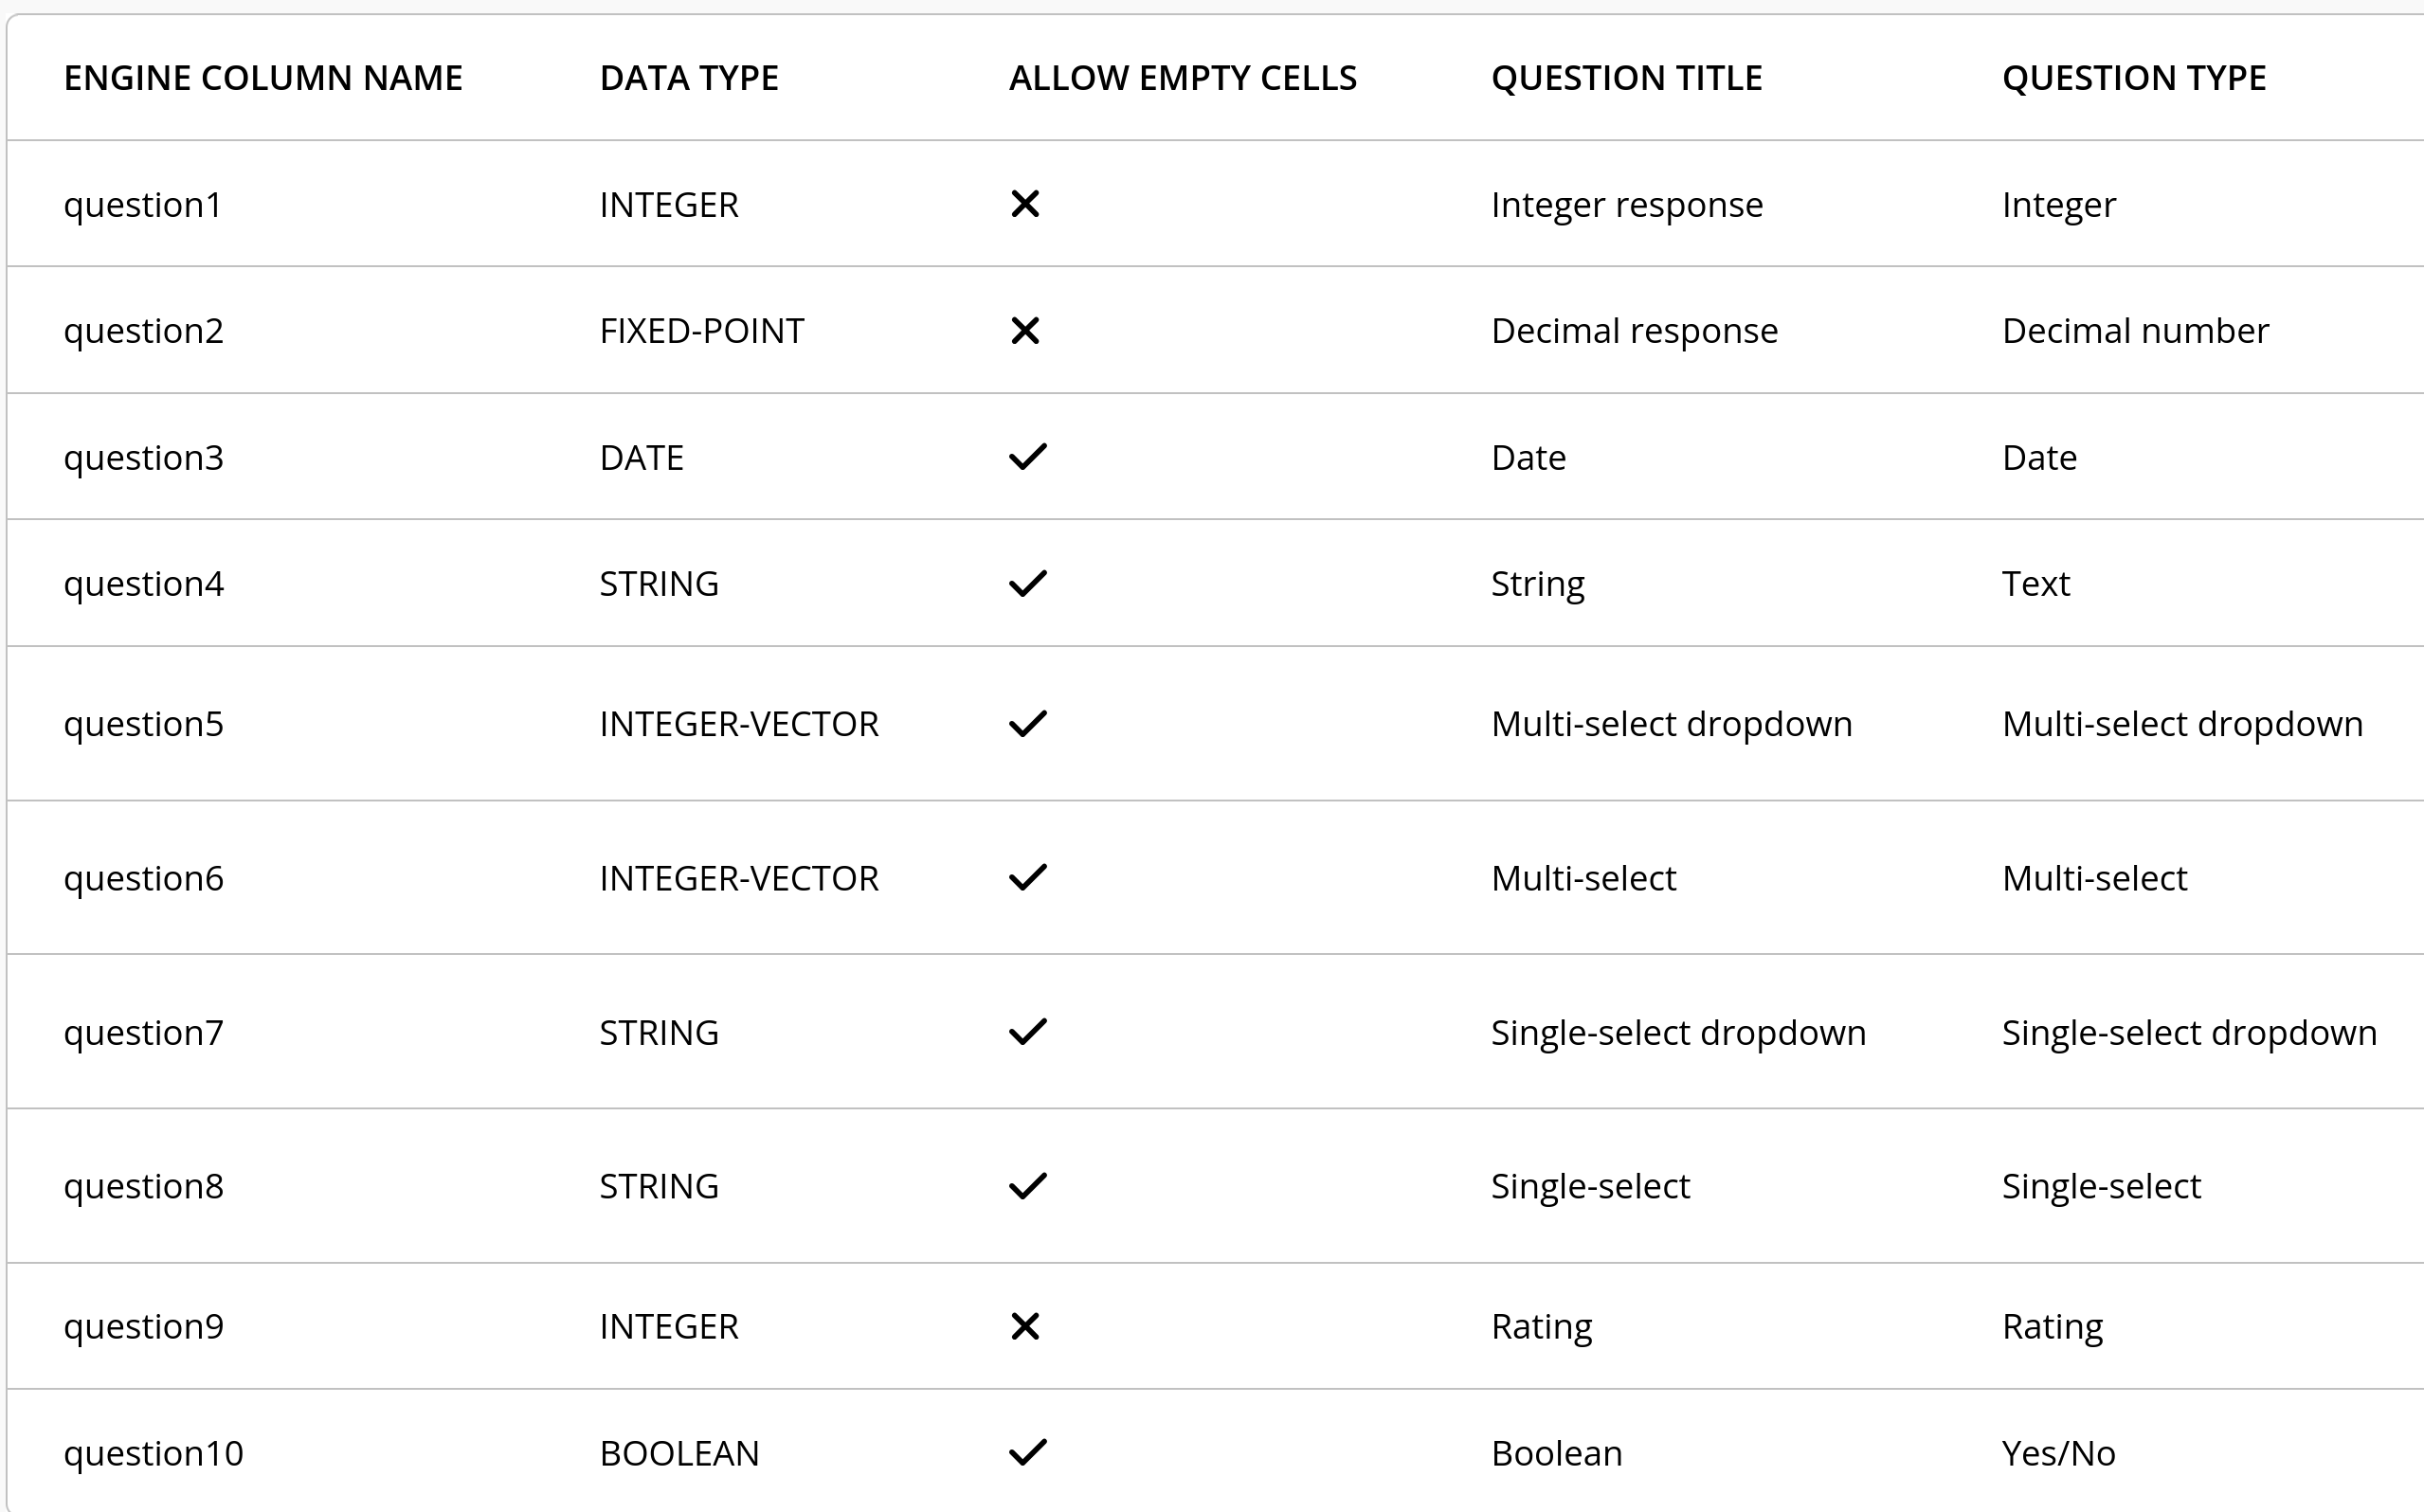
Each survey response will occur as a record in the table. The layout of this table will look as follows:
Table layout

To be able to process this data in crandas, we need an approved script. Start by follow steps 1-3 in this article on the help center. Then make sure the survey has been answered at least once, and generate its table handle by closing the survey.

Similar to data uploads, we first need to record a script on dummy data that has an identical structure as the survey table. This dummy table can be generated in several ways, for instance by uploading a table via the platform, recreating the survey in the design environment or generating the table within the script itself. Here, we will go for the latter option.
We start by filling in the environment variables in the design script (similar to analyzing platform data uploads, see also Platform data upload). For the table layout shown above, the following schema is given:
SCHEMA = {
    'question1': 'int',
    'question2': 'fp',
    'question3': 'date?[format=%Y-%m-%d]',
    'question4': 'varchar?',
    'question5': 'int_vec?',
    'question6': 'int_vec?',
    'question7': 'varchar?',
    'question8': 'varchar?',
    'question9': 'int',
    'question10': 'bool?',
}
On the basis of this schema, we can generate a dummy DataFrame:
import crandas as cd
import pandas as pd

SCHEMA = {
    'question1': 'int',
    'question2': 'fp',
    'question3': 'date?[format=%Y-%m-%d]',
    'question4': 'varchar?',
    'question5': 'int_vec?',
    'question6': 'int_vec?',
    'question7': 'varchar?',
    'question8': 'varchar?',
    'question9': 'int',
    'question10': 'bool?',
}

dummy_table = cd.DataFrame({
    'question1':[1,2,3],
    'question2':[0.1,0.2,0.3],
    'question3':["01/02/2000", "02/04/1991", "03/12/1993"],
    'question4':['a',pd.NA, 'c'],
    'question5':[[0,1,1],[0,1,1],[1,0,0]],
    'question6':[[0,1,1],[0,1,1],[1,0,0]],
    'question7':['Item1',pd.NA,'Item1'],
    'question8':['Item1','Item3','Item1'],
    'question9':[4,2,1],
    'question10':[1,0,1],
}, ctype=SCHEMA, auto_bounds=True
)
DUMMY_HANDLE = dummy_table.handle
The rest of the capitalized environment variables can be copied from the code snippet on the survey view in the authorized platform. This will give us the following script:
import crandas as cd
import pandas as pd

# copy from design platform:
DESIGN_ENV = "vdl-design-demo"

# copy from authorized platform:
AUTH_ENV = "vdl-demo"
ANALYST_KEY = "vdl-demo-private-key.sk"
PROD_HANDLE = "C9E0C7721E161E1FC60CFA4E61840DE1ACCBBC993880A3588EE12812DCDA037B"
SCHEMA = {
    'question1': 'int',
    'question2': 'fp',
    'question3': 'date?[format=%Y-%m-%d]',
    'question4': 'varchar?',
    'question5': 'int_vec?',
    'question6': 'int_vec?',
    'question7': 'varchar?',
    'question8': 'varchar?',
    'question9': 'int',
    'question10': 'bool?',
}


# fill this in yourself (no spaces):
ANALYSIS_NAME = "survey_analysis"

cd.connect(DESIGN_ENV, analyst_key=ANALYST_KEY)


dummy_table = cd.DataFrame({
    'question1':[1,2,3],
    'question2':[0.1,0.2,0.3],
    'question3':["2000-01-01", "2000-01-02", "2000-01-03"],
    'question4':['a',pd.NA, 'c'],
    'question5':[[0,1,1],[0,1,1],[1,0,0]],
    'question6':[[0,1,1],[0,1,1],[1,0,0]],
    'question7':['Item1',pd.NA,'Item1'],
    'question8':['Item1','Item3','Item1'],
    'question9':[4,2,1],
    'question10':[1,0,1]
    }, ctype=SCHEMA, auto_bounds=True
)
DUMMY_HANDLE = dummy_table.handle

script = cd.script.record(name=ANALYSIS_NAME, path=ANALYSIS_NAME + '.recording')

table = cd.get_table(dummy_handle=DUMMY_HANDLE, prod_handle=PROD_HANDLE, schema=SCHEMA)

## add any analysis on `table`

script.end()
This script loads the survey results into a table. To process those results, we need to access each individual column, and perform an aggregation on it:
import crandas as cd
import pandas as pd

# copy from design platform:
DESIGN_ENV = "vdl-design-demo"

# copy from authorized platform:
AUTH_ENV = "vdl-demo"
ANALYST_KEY = "vdl-demo-private-key.sk"
PROD_HANDLE = "C9E0C7721E161E1FC60CFA4E61840DE1ACCBBC993880A3588EE12812DCDA037B"
SCHEMA = {
    'question1': 'int',
    'question2': 'fp',
    'question3': 'date?[format=%Y-%m-%d]',
    'question4': 'varchar?',
    'question5': 'int_vec?',
    'question6': 'int_vec?',
    'question7': 'varchar?',
    'question8': 'varchar?',
    'question9': 'int',
    'question10': 'bool?',
}


# fill this in yourself (no spaces):
ANALYSIS_NAME = "survey_analysis"

cd.connect(DESIGN_ENV, analyst_key=ANALYST_KEY)


dummy_table = cd.DataFrame({
    'question1':[1,2,3],
    'question2':[0.1,0.2,0.3],
    'question3':["2089-01-01", "2000-01-02", "2000-01-03"],
    'question4':['a',pd.NA, 'c'],
    'question5':[[0,0,1],[0,1,1],[1,1,1]],
    'question6':[[0,1,1],[0,1,1],[1,0,0]],
    'question7':['Item1',pd.NA,'Item1'],
    'question8':['Item1','Item3','Item1'],
    'question9':[4,2,1],
    'question10':[True,False,True]
    }, ctype=SCHEMA, auto_bounds=True
)
DUMMY_HANDLE = dummy_table.handle

script = cd.script.record(name=ANALYSIS_NAME, path=ANALYSIS_NAME + '.recording')

table = cd.get_table(dummy_handle=DUMMY_HANDLE, prod_handle=PROD_HANDLE, schema=SCHEMA)

###### BEGIN: ANALYSIS ON SURVEY RESULTS ########

print('Total of question1: ' + str(table['question1'].sum()))
print('Minimum of question2: ' + str(table['question2'].min()))
print('What was the earliest year that was answered in question3?: ' +
    str(table['question3'].fillna(pd.to_datetime("2089-01-01")).year().min()))
print('How many times did respondents answer "a" in question4?: ' +
    str(len(table.filter(table['question4'].fillna("a") == "a"))))
print('How many times did respondents select "Item2" in question5?: ' +
    str(table['question5'].vsum().as_table()[1:2][""].sum()))

# get table of result of each response with inner product of integer vector where
# 'Item2' and 'Item3' are selected
table_inner = table['question6'].inner([0,1,1]).fillna(0)
print('How many times did respondents select "Item2" and "Item3" in question6?: ' +
    str(len(table_inner.as_table().filter(table_inner == 2))))

# get table of groupsizes for each value in question7
groupsizes_q7 = table.project(['question7']).fillna('').groupby('question7').size()
max_items = groupsizes_q7.filter(groupsizes_q7[''] ==
    cd.placeholders.Any(groupsizes_q7[''].max()))
print('Which item(s) were selected most often in question7?: ' +
    str(max_items.open()['question7'].to_list()))

print('How many times was "Item1" selected in question8?: ' +
    str(len(table.filter(table['question8'].fillna('') == 'Item1'))))
print('What was the average rating that people gave in question9?: ' +
    str(table['question9'].mean()))
print('Of all people who answered question10, what percentage answered "Yes"?: ' +
    str(round((len(table.filter(table['question10'].fillna(False) == True))/
    table['question10'].count())*100,2)) + "%")

script.end()

###### END: ANALYSIS ON SURVEY RESULTS ########
>>> Total of question1: 6
>>> Minimum of question2: 0.10000038146972656
>>> What was the earliest year that was answered in question3?: 2000
>>> How many times did respondents answer "a" in question4?: 2
>>> How many times did respondents select "Item2" in question5?: 2
>>> How many times did respondents select "Item2" and "Item3" in question6?: 2
>>> Which item(s) were selected most often in question7?: ['Item1']
>>> How many times was "Item1" selected in question8?: 2
>>> What was the average rating that people gave in question9?: 2.3333333333333335
>>> Of all people who answered question10, what percentage answered "Yes"?: 66.67%